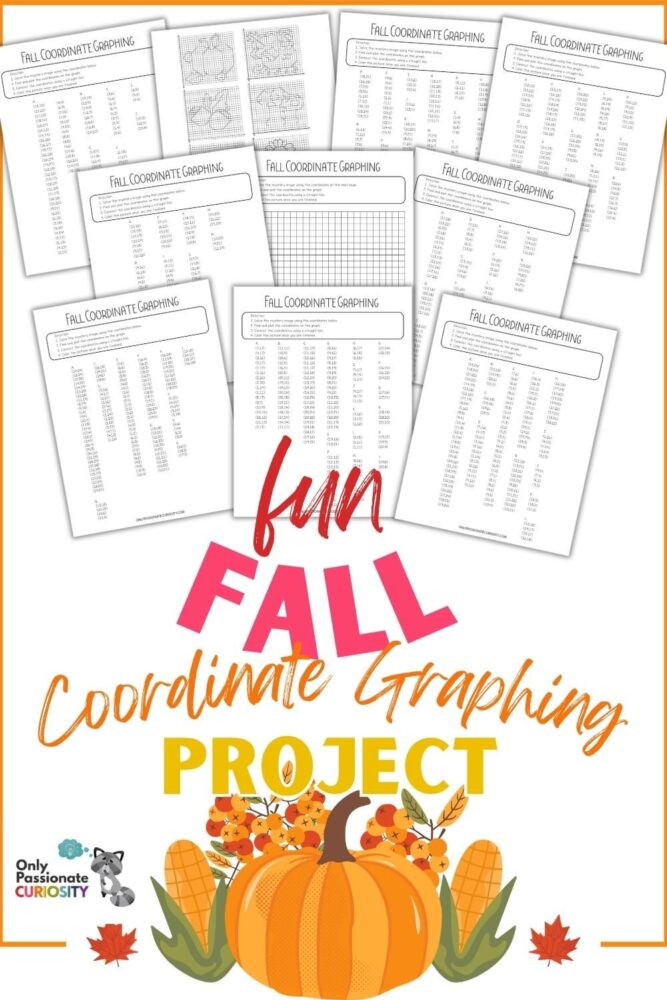
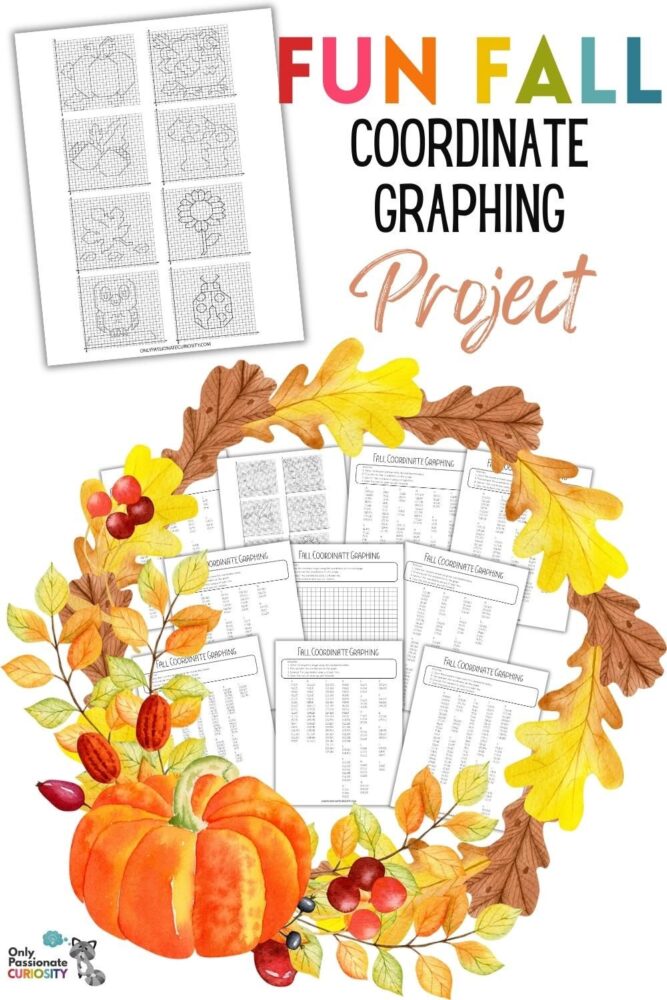
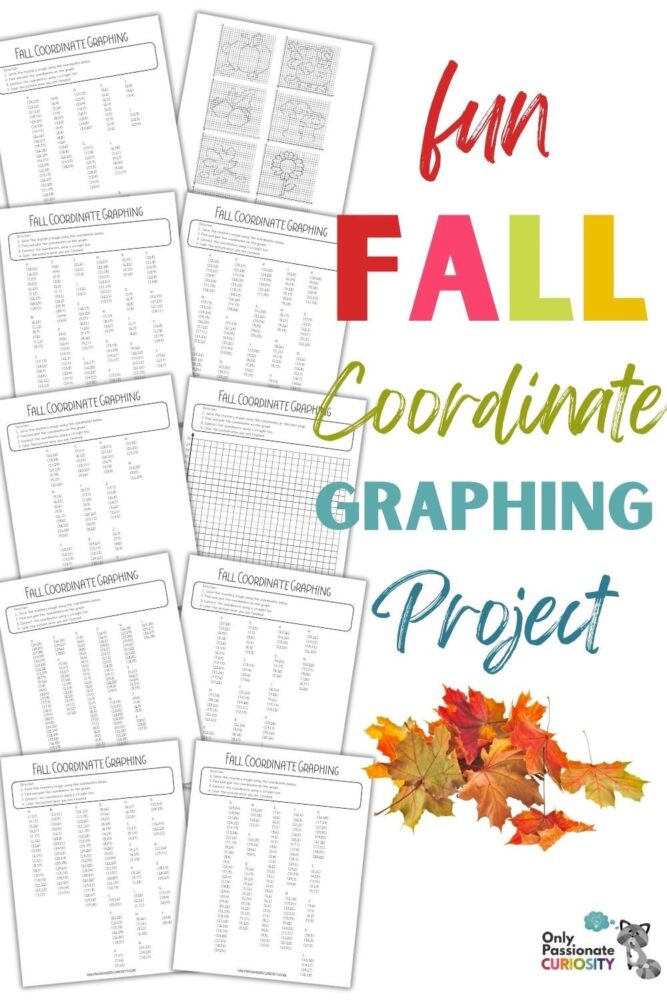
Fun Fall Coordinate Graphing Project
We have a fun fall coordinate graphing project below, as well as a fun way for you to explain coordinate graphing to your kids, but first let’s talk about why you want to teach this concept to your child.
Why Teach Coordinate Graphing
Teaching your child how to do coordinate graphing is an important skill to incorporate into your homeschool. Here are some of the skills your child will learn by mastering coodinate graphing.
An Educational Foundation:
Teaching your children the concept of coordinate graphing at a young age helps them establish a strong foundation in mathematics. It will help them begin to grasp mathematical concepts like geometry, algebra, and data analysis.
Visual Learning:
Graphs are a visual way to represent information. Teaching your homeschool class how to create and interpret graphs helps enhance their visual learning skills.
Real-World Applications:
When you launch into teaching your children coordinate graphing, you’ll want to show them real-life uses for this skill. For instance, they can relate it to navigation, architecture, or even simple activities like following a map.
Preparation for Future Education:
We all know how important STEM (Science, Technology, Engineering, and Mathematics) fields are and likely will continue to be in the future. Learning coordinate graphing early on can provide a head start and make advanced math concepts more accessible when your child reaches them.
Engagement and Interest:
You can make coordinate graphing engaging and interesting for their children with a project like this fall coordinate graphing project. This can foster a love for learning and curiosity about the world.
How to Teach Coordinate Graphing to Your Kids
Okay, now to the topic of how to explain coordinate graphing to your kids!
You can, of course, open a math textbook, but if you need a bit of help when your homeschoolers ask the inevitable, “Why do I have to learn this?” here is a fun way to explain coordinate graphing:
Imagine you’re on a treasure hunt, but instead of searching for buried gold, you’re exploring the wonderful world of coordinate graphing. It’s like a cool adventure with your trusty map!
Here’s how it works: Picture a big piece of paper, like a treasure map, with two perpendicular lines running through it. These lines are your secret weapons; they’re called the X-axis and Y-axis. The X-axis is the horizontal line, and the Y-axis is the vertical one.
Now, let’s say you’ve got some mysterious points on this map, and you want to find their exact locations. That’s where the magic happens! Each point has a unique set of coordinates, like an address. The X-coordinate tells you how far you should move left or right on the X-axis, and the Y-coordinate tells you how far up or down on the Y-axis. Think of them as the treasure’s latitude and longitude!
To plot a point, start at the intersection of the axes, known as the origin. Then, follow your coordinates like a treasure map clue. If your X-coordinate is 3 and your Y-coordinate is 4, you move 3 steps to the right and 4 steps up, and BOOM! You’ve found your treasure point.
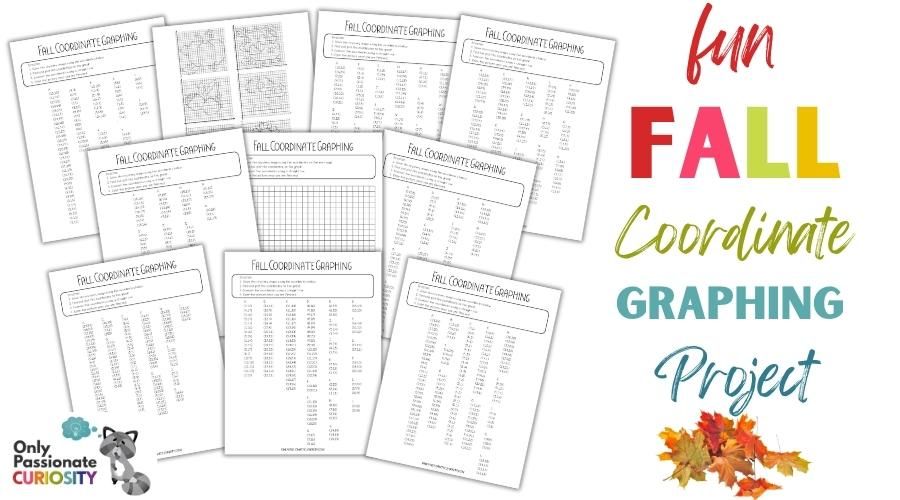
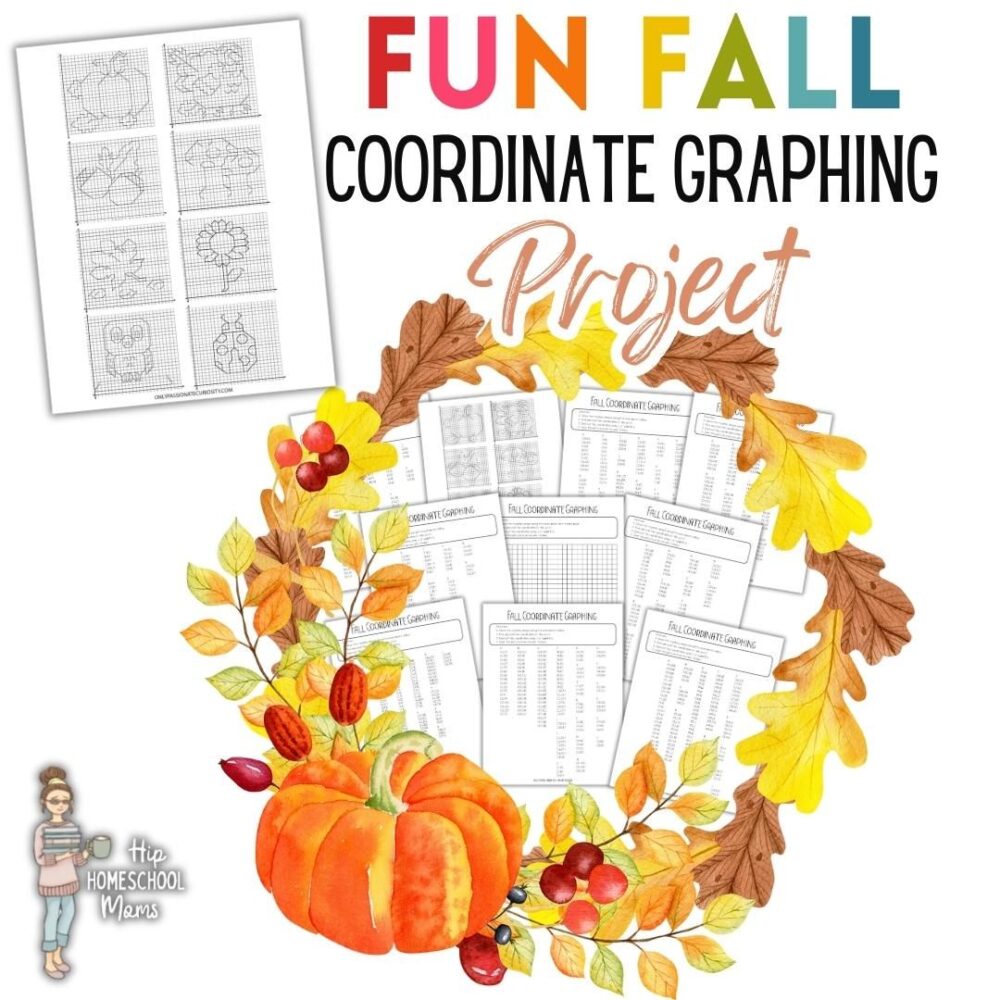
But wait, there’s more! You can connect these points to create shapes, lines, and all sorts of cool patterns. It’s like drawing with numbers! And this coordinate graphing project has neat fall-themed images that will slowly appear before your eyes as you connect the points.
Coordinate graphing is basically a treasure hunt for points on a map made of two lines, X and Y, where each point has its secret coordinates. It’s a bit like being a math detective on a quest for hidden treasures in the world of numbers and graphs. Happy graphing!

Other Simple Graphing Projects
If your kids aren’t quite ready for coordinate graphing, here are some easier graphing projects you can teach in your homeschool class:


